|
Simple Internet Meter 2.3.0
==Official Mirror==
Simple Internet Meter 2.3.0
Simple Internet Meter is my new bandwidth monitor. After my program CS Fire Monitor came out years ago I had many requests for added features. Many of those features where not possible to add using the Windows API. Such as seeing what is internet traffic and what is local network traffic. The only way to accomplish this is to look at the packet data. So I made this program using WinPcap and PacketX.dll.
Limitations: 14-day trial
To view the Help & FAQ for Simple Internet Meter - http://www.pcwintech.com/simple-internet-meter-help
To view a video on the features and information on Simple Internet Meter - http://www.pcwintech.com/files/simple_internet_meter_video/index.htm
Lite and standard features include:
Monitor Network Traffic.
Monitor a range of ports
Keep logs of Daily & Hourly Usage
Auto save any report to a file.
Easily change the colors to fit your style and taste.
Resize the monitors to make then very small and transparent, keeping them out of the way
Blend to desktop mode makes the monitors blend to your desktop.
Ghost mode makes the monitors click through.
System tray icon can be animated to show network traffic.
Open network connections and Windows firewall settings from the right click menu of the tray icon. (This makes getting to these areas much easier in Vista and Windows 7)
Repair and view Network Information from the right click menu.
View Detailed Netstats, showing what ports are being used and by what program.
Extra Stats
Features available only in the standard version:
Remote View (Monitor Multiple Computers from any where in the world)
Bandwidth Quotas
Quota Alerts
Determine what is Internet & Local Traffic
Changelog:
Major code updates and tweaks.
Better handling when system comes out of sleep.
|
 |
9,092 |
Dec 21, 2013
PcWinTech |
|
Simple Internet Meter Lite 2.3.0
==Official Mirror==
Simple Internet Meter Lite 2.3.0
Simple Internet Meter is my new bandwidth monitor. After my program CS Fire Monitor came out years ago I had many requests for added features. Many of those features where not possible to add using the Windows API. Such as seeing what is internet traffic and what is local network traffic. The only way to accomplish this is to look at the packet data. So I made this program using WinPcap and PacketX.dll.
Lite and standard features include:
Monitor Network Traffic.
Monitor a range of ports
Keep logs of Daily & Hourly Usage
Auto save any report to a file.
Easily change the colors to fit your style and taste.
Resize the monitors to make then very small and transparent, keeping them out of the way
Blend to desktop mode makes the monitors blend to your desktop.
Ghost mode makes the monitors click through.
System tray icon can be animated to show network traffic.
Open network connections and Windows firewall settings from the right click menu of the tray icon. (This makes getting to these areas much easier in Vista and Windows 7)
Repair and view Network Information from the right click menu.
View Detailed Netstats, showing what ports are being used and by what program.
Extra Stats
Features available only in the standard version:
Remote View (Monitor Multiple Computers from any where in the world)
Bandwidth Quotas
Quota Alerts
Determine what is Internet & Local Traffic
Changelog:
Major code updates and tweaks.
Better handling when system comes out of sleep.
|
|
9,186 |
Dec 21, 2013
PcWinTech |
|
Temperature Icon Meter v2.4
Temperature Icon Meter v2.4
A small "notifyicon" system temperature meter for Windows.
It displays small notifyicon which visualize the user selected current temperature readings in small bars. Also it will record the minimum and maximum temperature readings during its running. The temperature readings is collected via WMI interface provided by Open Hardware Monitor.
Features:
• Customizable bar colors for safe / warning / danger temperatures ranges.
• Customizable temperature ranges (safe / warning / danger).
• Customizable display names for any detected temperature sensors.
• Use vertical or horizontal bars
• Autostart when Windows start up
• Display numerical readings in popup tooltip message when mouse cursor hovers over the meter
Usage:
• Left click the meter icon to show the popup window.
• Right click the meter icon to access the setup dialog (setup menu item), or to close the program (Close menu item).
• Select the check box of a temperature sensor to include it in the notifyicon and make it highlighted in the popup window.
• Click the blue link to edit the display name of any temperature sensor, the display name will be shown in the popup tooltip and popup window.
• Currently 4 languages (traditional Chinese, simplified Chinese, English and Japanese) are supported, you can select your desired language in the setup dialog.
• All settings could be found in the setup dialog.
Notes:
• Temperature Icon Meter needs user to confirm the UAC (User Account Control) prompt during its first run, and it should start automatically without interruption next time if you enable the Run at Startup option.
• Temperature Icon Meter ... |
 |
50 |
Mar 20, 2025
Oscar Kin-Chung Au 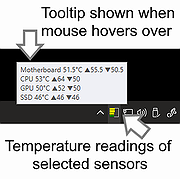 |
|
UpDown Meter v1.2.3
UpDown Meter v1.2.3
UpDown Meter graphs network activity for a specific network adapter. It is deliberately designed to consume trace memory and processor time, so it can run as long as the system runs, providing an overview of how the connection is being used.
Usage
When UpDown Meter is first run we see a prompt to choose a network adapter.
To select an adapter, open the settings menu by clicking the button in the lower-right of the toolbox () or choose the settings option from the tray icon menu. Once an adapter has been selected and confirmed by clicking the [OK] or [Apply] buttons, the graph updates to show a scrolling image that updates once per second, as shown below.
Each block divided by a dashed vertical line represents a unit of 30 seconds, so this graph is showing the last 61 seconds of network activity. Since the graph appears empty, either there is no activity or our graph is calibrated incorrectly. Once the graph has been calibrated it might look something like the following.
The graph scrolls from right to left, so the newest information is displayed on the right. Red indicates downloaded data whilst green represents uploaded data. Yellow represents uploaded or downloaded data, depending on which is lesser at that point in time—it sounds weird but it's actually quite visually intuitive!
Reading from the left, the graph above shows we started downloading data at full speed for about 80 seconds. Then, we stopped downloading and uploaded data at full speed for about 60 seconds (our upload capacity is approximately a quarter of our download capacity). Next, we started downloading at full speed whilst simultaneously continuing our upload for two minutes. During this period, we observe that our connection is unable to reach maximum download speed whilst also uploading at full speed. This is ... |
|
5,236 |
Feb 09, 2019
ScriptFUSION 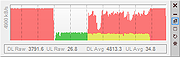 |