 |
LTris v1.2.3
LTris v1.2.3
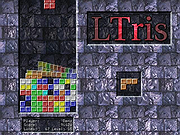
A free Tetris clone that follows the original rules but adds some extras.
LTris is a tetris clone. Pieces consisting of four blocks are dropping down and need to be stacked in the playing field so that lines get completed. Pieces can be shifted left/right or rotated. Completed lines get removed. The more lines at once the more score you get. When the next piece cannot be placed on top of the playing field the game ends.
There are different game modes (Normal: Regular game starting with an empty playing field. Figures: Each level has a new figure that needs to be cleared, later on new blocks and lines suddenly appear. Multiplayer: You can play either against up to two other human or computer players.) and two game styles (Classic: Follows the classic hardcore rules of NES tetris. Modern: Adds stuff like 7-bag, piece shadow, lock delay, wall kicks, ... for a more casual way to play).
Fully portable. No install needed.
Click here to visit the author's website. |
 |
2,334 |
Jan 02, 2023
Michael Speck- LGames  |
 |
Memory Checker v1.2.3
Memory Checker v1.2.3
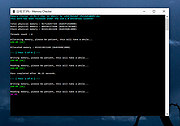
A simple memory stress-testing tool. It is useful to test the reliability of your computer's main memory (RAM) under “high” load.
Because the Memory Checker runs as a “normal” Windows application, it is very easy to use. See the limitations below.
Disclaimer
Memory Checker puts a high stress on your computer's hardware and thus may trigger hardware problems that otherwise would have remained unnoticed.
Be patient when running this tool. Your computer may appear to be frozen but it is not.
It is possible that this will cause your system to crash. In extremely rare circumstances even permanent damage or data loss is possible!
In no event will the authors of this program be liable to you for damages, including any general, special, incidental or consequential damages arising out of the use or inability to use the program; including but not limited to loss of data or data being rendered inaccurate or losses sustained by you or third parties or a failure of the program to operate with any other programs.
By running this program on your machine, you acknowledge and agree that the use of this program is at your own risk.
Synopsis
The Memory Checker program is invoked as follows:
MemoryChecker.exe [OPTIONS] [<target_memory_size>[%]] [<threads>]
Specifying the amount of memory to be tested and the number of threads to be used is optional. If not specified explicitly, default values apply.
The amount of memory to be tested can be specified as a percentage of the total physical memory.
Note: Its is highly recommended to close all other programs that are running on your machine before the Memory Checker tool is launched.
Options
The following command-line options are available:
--batch:
Exit the program immediately (i.e. do not wait for a key press) when the test has completed or failed.
--continuous:
... |
 |
2,672 |
Feb 12, 2023
LoRd_MuldeR  |
 |
UpDown Meter v1.2.3
UpDown Meter v1.2.3
UpDown Meter graphs network activity for a specific network adapter. It is deliberately designed to consume trace memory and processor time, so it can run as long as the system runs, providing an overview of how the connection is being used.
Usage
When UpDown Meter is first run we see a prompt to choose a network adapter.
To select an adapter, open the settings menu by clicking the button in the lower-right of the toolbox () or choose the settings option from the tray icon menu. Once an adapter has been selected and confirmed by clicking the [OK] or [Apply] buttons, the graph updates to show a scrolling image that updates once per second, as shown below.
Each block divided by a dashed vertical line represents a unit of 30 seconds, so this graph is showing the last 61 seconds of network activity. Since the graph appears empty, either there is no activity or our graph is calibrated incorrectly. Once the graph has been calibrated it might look something like the following.
The graph scrolls from right to left, so the newest information is displayed on the right. Red indicates downloaded data whilst green represents uploaded data. Yellow represents uploaded or downloaded data, depending on which is lesser at that point in time—it sounds weird but it's actually quite visually intuitive!
Reading from the left, the graph above shows we started downloading data at full speed for about 80 seconds. Then, we stopped downloading and uploaded data at full speed for about 60 seconds (our upload capacity is approximately a quarter of our download capacity). Next, we started downloading at full speed whilst simultaneously continuing our upload for two minutes. During this period, we observe that our connection is unable to reach maximum download speed whilst also uploading at full speed. This is ... |
 |
5,200 |
Feb 09, 2019
ScriptFUSION  |

