A Plea.
Deanna and I (Your Older Geeks) have been running OlderGeeks.com since 2008 and lately we are seeing a major increase in usage (and cost) but a big decline in percentage of users who donate. Our ad-free and junkware-free download site only works if everyone chips in to offset the revenue that ads on other sites bring in.
Please donate on the website today. Every little bit helps.
Thank you so much.
-D&R
Always scroll to the bottom of the page for the main download link.
We don't believe in fake/misleading download buttons and tricks. The link is always in the same place.
Plot Digitizer v2.6.11
Digitize data points off of scanned plots, scaled drawings, or orthographic photographs.
Includes an automatic digitization feature that can automatically digitize many types of functional data.
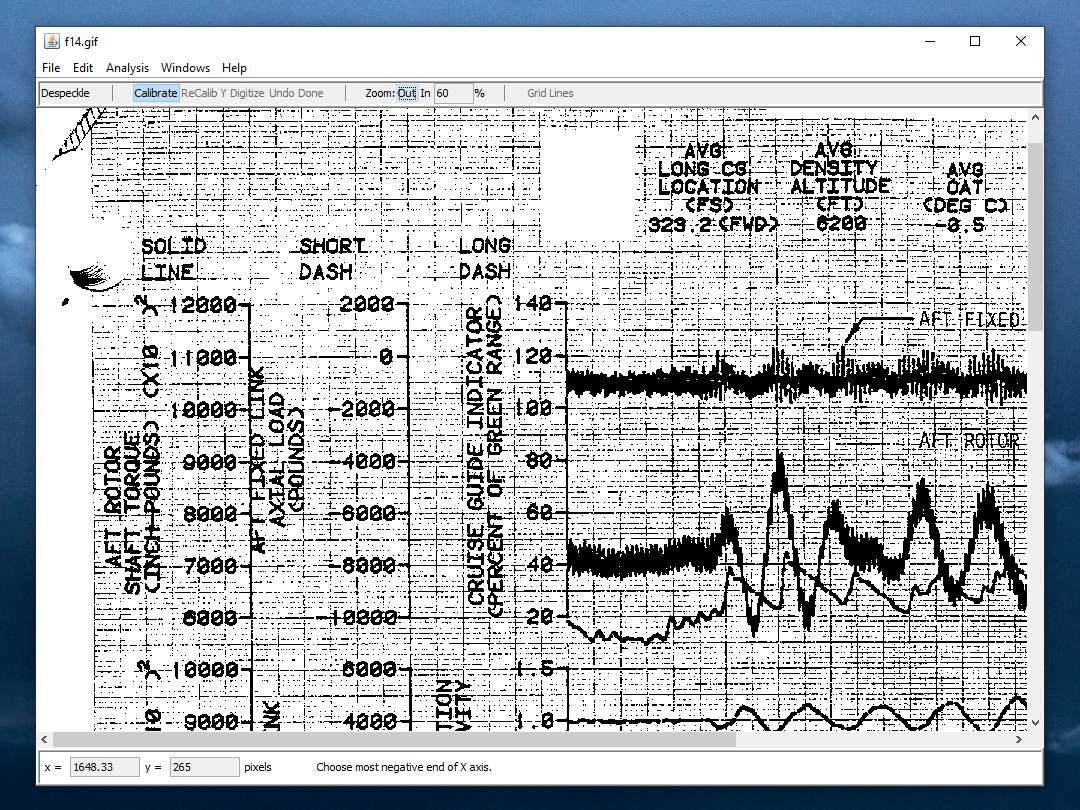
Plot Digitizer is a Java program used to digitize scanned plots of functional data. Often data is found presented in reports and references as functional X-Y type scatter or line plots. In order to use this data, it must somehow be digitized. This program will allow you to take a scanned image of a plot (in GIF, JPEG, or PNG format) and quickly digitize values off the plot just by clicking the mouse on each data point. The numbers can then be saved to a text file and used where ever you need them. Plot Digitizer works with both linear and logarithmic axis scales. Besides digitizing points off of data plots, this program can be used to digitize other types of scanned data (such as scaled drawings or orthographic photos).
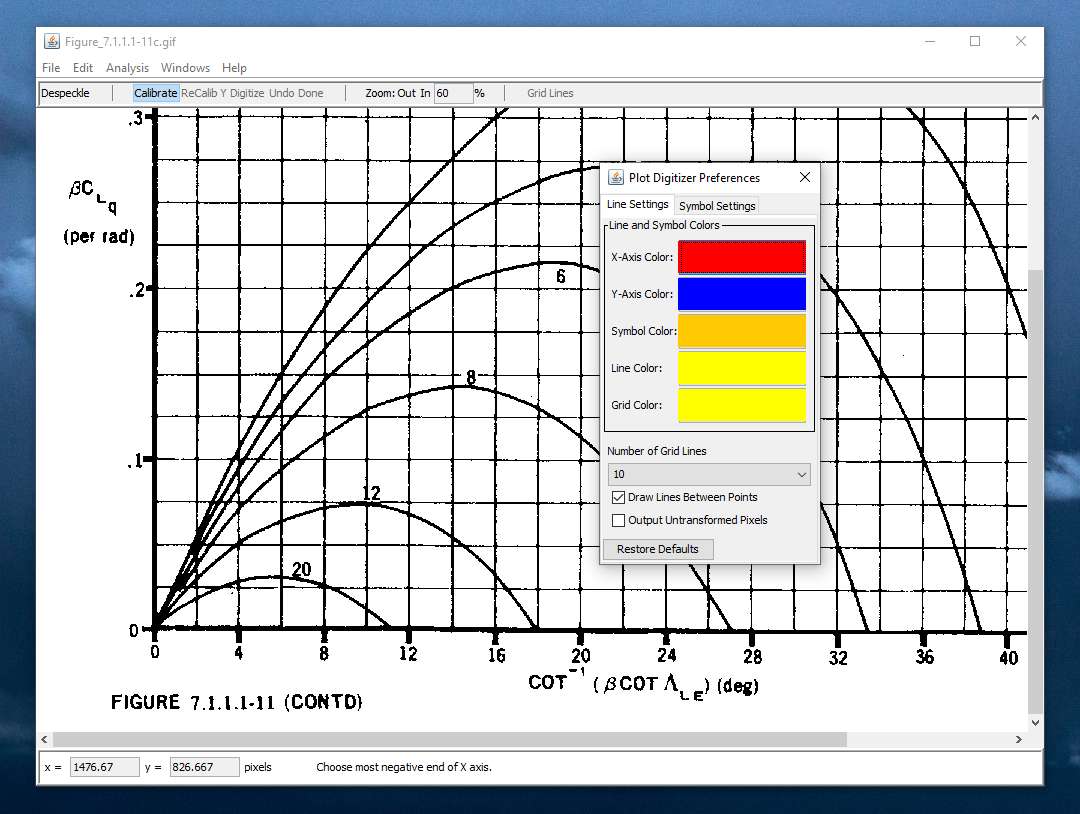
To make the digitizing task easier, this program includes many handy features. For example: You can recalibrate the Y axis without having to recalibrate the X axis (multiple sets of data are commonly plotted with the same X axis). You can insert points between two already digitized points by right clicking and choosing "Insert" from the pop-up menu. You can delete points by right-clicking on the points and choosing "Delete". You can move points by clicking and dragging them. You can compute the length of a digitized curve and you can compute the area of a digitized polygon. You can zoom images in and out. You can save calibrations for an image for later use, and finally, there is unlimited undo/redo.
A special feature of this program is the ability to semi-automatically digitize lines off a plot. The user simply indicates where the line is on the plot with a thick paint brush and the program attempts to automatically sort out the data from grid lines, etc. This auto-digitizing feature depends on an image vectorization program called "autotrace". In order to use the auto-digitizing feature, you must have the open source autotrace image vectorization program installed. Unfortunately, autotrace does not currently seem to work on the Windows platform.
Will the auto-digitizing feature digitize any plot? Short answer: no. Long answer: The auto-digitizing feature works best with black and white, 300 dpi images of continuous data which does not run vertically (vertical lines give it fits), does not repeatedly cross other data lines, is not close to and parallel to grid lines, is not extremely noisy and which does not have plot symbols. After using the program a while you begin to learn what it can and can't auto-digitize. However, even in cases where it doesn't auto-digitize the entire line, you can sometimes do a piece of it automatically, then manually digitize a piece, and then do another piece automatically, etc. I've found this feature to be pretty useful on digitizing plots of experimental test time histories, but your mileage may vary.
Install Notes:
macOS
You should have received this application as a compressed disk image file (PlotDigitizer_#.#.#_MacOS.dmg). This disk image file, when mounted (by double-clicking on it), should contain the application icon (Plot Digitizer.app, this readme file (README.txt), and some license related legalese.
To install this program, simply drag the Plot Digitizer.app icon to a convenient location on your computer. In MacOS this is usually the "Applications" directory, but you are free to put it anywhere you want.
The application should work properly on MacOS 11.3 and later right out of the box. No additional software required (you do not need to have Java installed).
On MacOS the default security settings may prevent you from being able to run Plot Digitizer since it was downloaded from the internet and is does not have an Apple Developer ID signature (author is not an "identified developer"). You may need to do the following:
1) Open System Preferences
2) Open Security & Privacy
3) Scroll down to "Security"
4) Find a message saying that Plot Digitizer was prevented from running because it is from an unknown developer and click the "Run Anyway" button.
You should be able to run Plot Digitizer from then on.
If you want to use the auto-digitize feature, you must acquire and install the autotrace program separately. Also, the autotrace program must appear on the System search path. I recommend you use either the Fink or MacPorts package managers to install autotrace. Plot Digitizer will find autotrace automatically if one of those package managers are used. Otherwise, if you install autotrace from source or from a binary distribution, make sure the executable is found in /usr/local/bin or /usr/bin.
Windows
You will first have to make sure that you have Java 11 or later (JRE or JDK) installed on your computer. If you do not, you can get it from: https://www.java.com/en/.
You should have received this application as a ZIP archive file (PlotDigitizer_#.#.#_Windows.zip). Uncompress this archive. It contains a double-clickable JAR file (PlotDigitizer.jar), a readme file (README.txt), and some license related legalese.
To install this program, simply drag the PlotDigitizer.jar file to a convenient location on your computer. It should work from anywhere.
If you want to use the auto-digitize feature, you must acquire and install the autotrace program separately. Also, the autotrace program must appear on the user's search path. After installing or building autotrace, add it to the search path. To do this, from the "Start" menu choose "Settings" and then "Control Panel" and from the Control Panel window double-click on "System." Then click on the "Advanced" tab and then the "Environment Variables" button. Under "User variables" if the PATH variable is listed, then select the PATH variable and click on the "Edit" button. Enter the path to the directory containing the autotrace executable (path items are separated by semi-colon (";") characters). Otherwise, click on the "New" button, enter "PATH" for the variable name and enter the path to the directory containing autotrace for the variable value.
Linux (and many flavors of UNIX):
You will first have to make sure that you have Java 11 or later (JRE or JDK) installed on your computer and on your search path. If you do not, you can get it from: https://www.java.com/en/.
You should have received this application as a compressed archive file (PlotDigitizer_#.#.#_Linux.tgz). After decompressing this file using "tar -xvzf PlotDigitizer_#.#.#_Linux.tgz", you will get a file named PlotDigitizer.jar. This is a "double-clickable" jar file, or you can run it from the command line using:
java -Xmx128m -jar PlotDigitizer.jar
You may want to create a shell script to do this for you.
If you want to use the auto-digitize feature, you must acquire and install the autotrace program separately. Also, the autotrace program must appear on the user's search path.
Usage Notes:
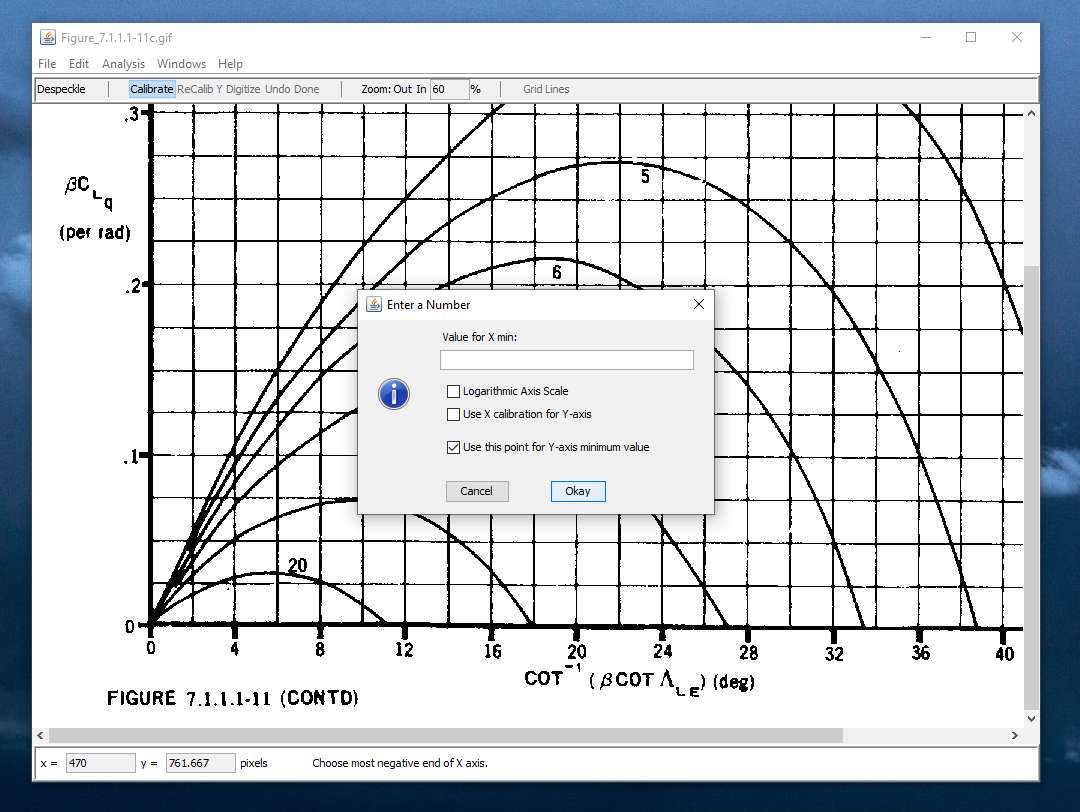
Quick Instructions: To use this program, first scan a plot with your favorite scanning system, then save the plot as a GIF, PNG, or JPEG format file. Run Plot Digitizer, open the scanned image file from the "Open" command in the "File" menu. Then follow the instructions at the bottom of the window to calibrate the plot and then digitize the points.
If you want to compute the length of a digitized line or the area enclosed by a digitized polygon, then you will need to pick those options from the Analysis menu before clicking on the "Done" button.
Hint: If you want to digitize plots from published technical reports that are available electronically in PDF format, you can skip the "print and then scan" step and keep everything digital. On Windows you can use Acrobat Reader and on MacOS you can use Preview to select a rectangular area and copy it to the clipboard (at screen resolution, so zoom in first). Then use a graphics program to paste in the image and save it to a GIF or PNG file. Then you can use that file with Plot Digitizer. Under Linux (and other flavors of UNIX such as MacOS X), you can use the PDF Toolkit to extract the page you want and then use ImageMagic to convert it to GIF or PNG at any resolution you want. Then you can use the file with Plot Digitizer.
This download is for the Windows version (very bottom of page).
All other download assets are below:
macOS:
PlotDigitizer_MacOS.dmg
Linux/Unix:
PlotDigitizer_Linux_and_Others.tgz
Click here to visit the author's website.
Continue below for the main download link.
|


 , out of 2 Votes.