Help!
Deanna and I have been running this site since 2008 and lately we're seeing a big increase in
users (and cost) but a decline in percentage of users who donate. Our ad-free and junkware-free
download site only works if everyone chips in to offset the revenue that ads on other sites bring
in. Please donate at the bottom of the page. Every little bit helps. Thank you so much.
Sincerely,
your Older Geeks: Randy and Deanna
Always scroll to the bottom of the page for the main download link.
We don't believe in fake/misleading download buttons and tricks. The link is always in the same place.
SimpleProgramDebugger v1.16
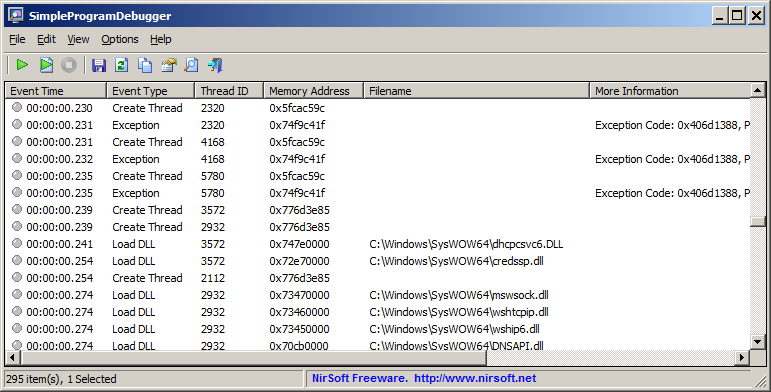
A simple debugging tool for Windows that attaches to existing running program or starts a new program in debugging mode, and then displays all major debugging events occurs while the program is running, including Exception, Create Thread, Create Process, Exit Thread, Exit Process, Load DLL, Unload Dll, and Debug String.

After the debugging events are accumulated, you can easily export them into comma-delimited/tab-delimited/xml/html file or copy them to the clipboard and then paste them into Excel or any other spreadsheet application.
System Requirements
This utility works on any version of Windows, starting from Windows XP and up to Windows 11. Both 32-bit and 64-bit systems are supported.
Changes:
Version 1.16:
Added 'Add Header Line To CSV/Tab-Delimited File' option (Turned on by default).
Fixed a few high DPI mode issues.
Fixed a bug that caused a small token handles leak (In the 'Select Process' window).
Start Using SimpleProgramDebugger
SimpleProgramDebugger doesn't require any installation process or additional dll files. In order to start using it, simply run the executable file - SimpleProgramDebugger.exe
After running SimpleProgramDebugger, you can attach a program that is already running by pressing F7 and choosing the desired process, or you can start a new program by pressing Ctrl+N and choosing the .exe file to run, and optionally parameters and start folder.
After the debugging events are displayed in the main window of SimpleProgramDebugger, you can select one or more events, and then use the 'Save Selected items' option to export them into comma-delimited/tab-delimited/xml/html file or press Ctrl+C to copy them to the clipboard, and then paste them into Excel or any other spreadsheet application.
Command-Line Options
/DebugProcess <Process ID/Filename> Start to debug an existing process. You can specify the process ID or process filename, for example:
SimpleProgramDebugger.exe /DebugProcess explorer.exe
SimpleProgramDebugger.exe /DebugProcess "c:\temp\myexe.exe"
SimpleProgramDebugger.exe /DebugProcess 4522
/StartDebugProcess Start a new process and debug it. You can specify the process filename in the /NewProcess.ProcessPath command-line option, the process parameters in the /NewProcess.Params command-line option and the process start folder in the /NewProcess.StartFolder command-line option.
Example:
SimpleProgramDebugger.exe /StartDebugProcess /NewProcess.ProcessPath "c:\windows\system32\taskmgr.exe"
/NewProcess.ProcessPath <Process Filename> Specifies the process filename to start, for using with the /StartDebugProcess command.
/NewProcess.Params <Command-Line Parameters> Specifies the parameters for the process to start, for using with the /StartDebugProcess command.
/NewProcess.StartFolder <Process Start Folder> Specifies the start folder of the process, for using with the /StartDebugProcess command.
/RunAsAdmin Run SimpleProgramDebugger as Administrator.
Translating SimpleProgramDebugger to other languages
In order to translate SimpleProgramDebugger to other language, follow the instructions below:
Run SimpleProgramDebugger with /savelangfile parameter:
SimpleProgramDebugger.exe /savelangfile
A file named SimpleProgramDebugger_lng.ini will be created in the folder of SimpleProgramDebugger utility.
Open the created language file in Notepad or in any other text editor.
Translate all string entries to the desired language. Optionally, you can also add your name and/or a link to your Web site. (TranslatorName and TranslatorURL values) If you add this information, it'll be used in the 'About' window.
After you finish the translation, Run SimpleProgramDebugger, and all translated strings will be loaded from the language file.
If you want to run SimpleProgramDebugger without the translation, simply rename the language file, or move it to another folder.
License
This utility is released as freeware. You are allowed to freely distribute this utility via floppy disk, CD-ROM, Internet, or in any other way, as long as you don't charge anything for this and you don't sell it or distribute it as a part of commercial product. If you distribute this utility, you must include all files in the distribution package, without any modification !
Disclaimer
The software is provided "AS IS" without any warranty, either expressed or implied, including, but not limited to, the implied warranties of merchantability and fitness for a particular purpose. The author will not be liable for any special, incidental, consequential or indirect damages due to loss of data or any other reason.
Feedback
If you have any problem, suggestion, comment, or you found a bug in this utility, you can send a message to nirsofer@yahoo.com
This download is for the 64bit version. If you need the 32bit version, download here.
Click here to visit the author's website.
Continue below for the main download link.
|


 , out of 77 Votes.
